Logistics
Querri uses AI to clean and analyze data to help optimize complex and manual processes across the supply chain. Predictive analytics enables better demand forecasting and inventory management.
Consolidate, Clean, Join, and Analyze your Data
Querri pulls data from anywhere—WMS, TMS, ERP, spreadsheets—and gives you instant control.
With no code and no technical skills required, you can clean, analyze, and visualize your data in minutes. Querri’s dashboards stay connected to your live data, so you can go from high-level insight to root-cause analysis in a click—spotting problems faster and saving time, money, and sanity.
Curious about how Querri can help with specific KPI's?
Perfect Order Rate (POR)
Cost per Shipment/Order
Freight cost as percentage of sales
Read more about Querri's cleaning tool here.

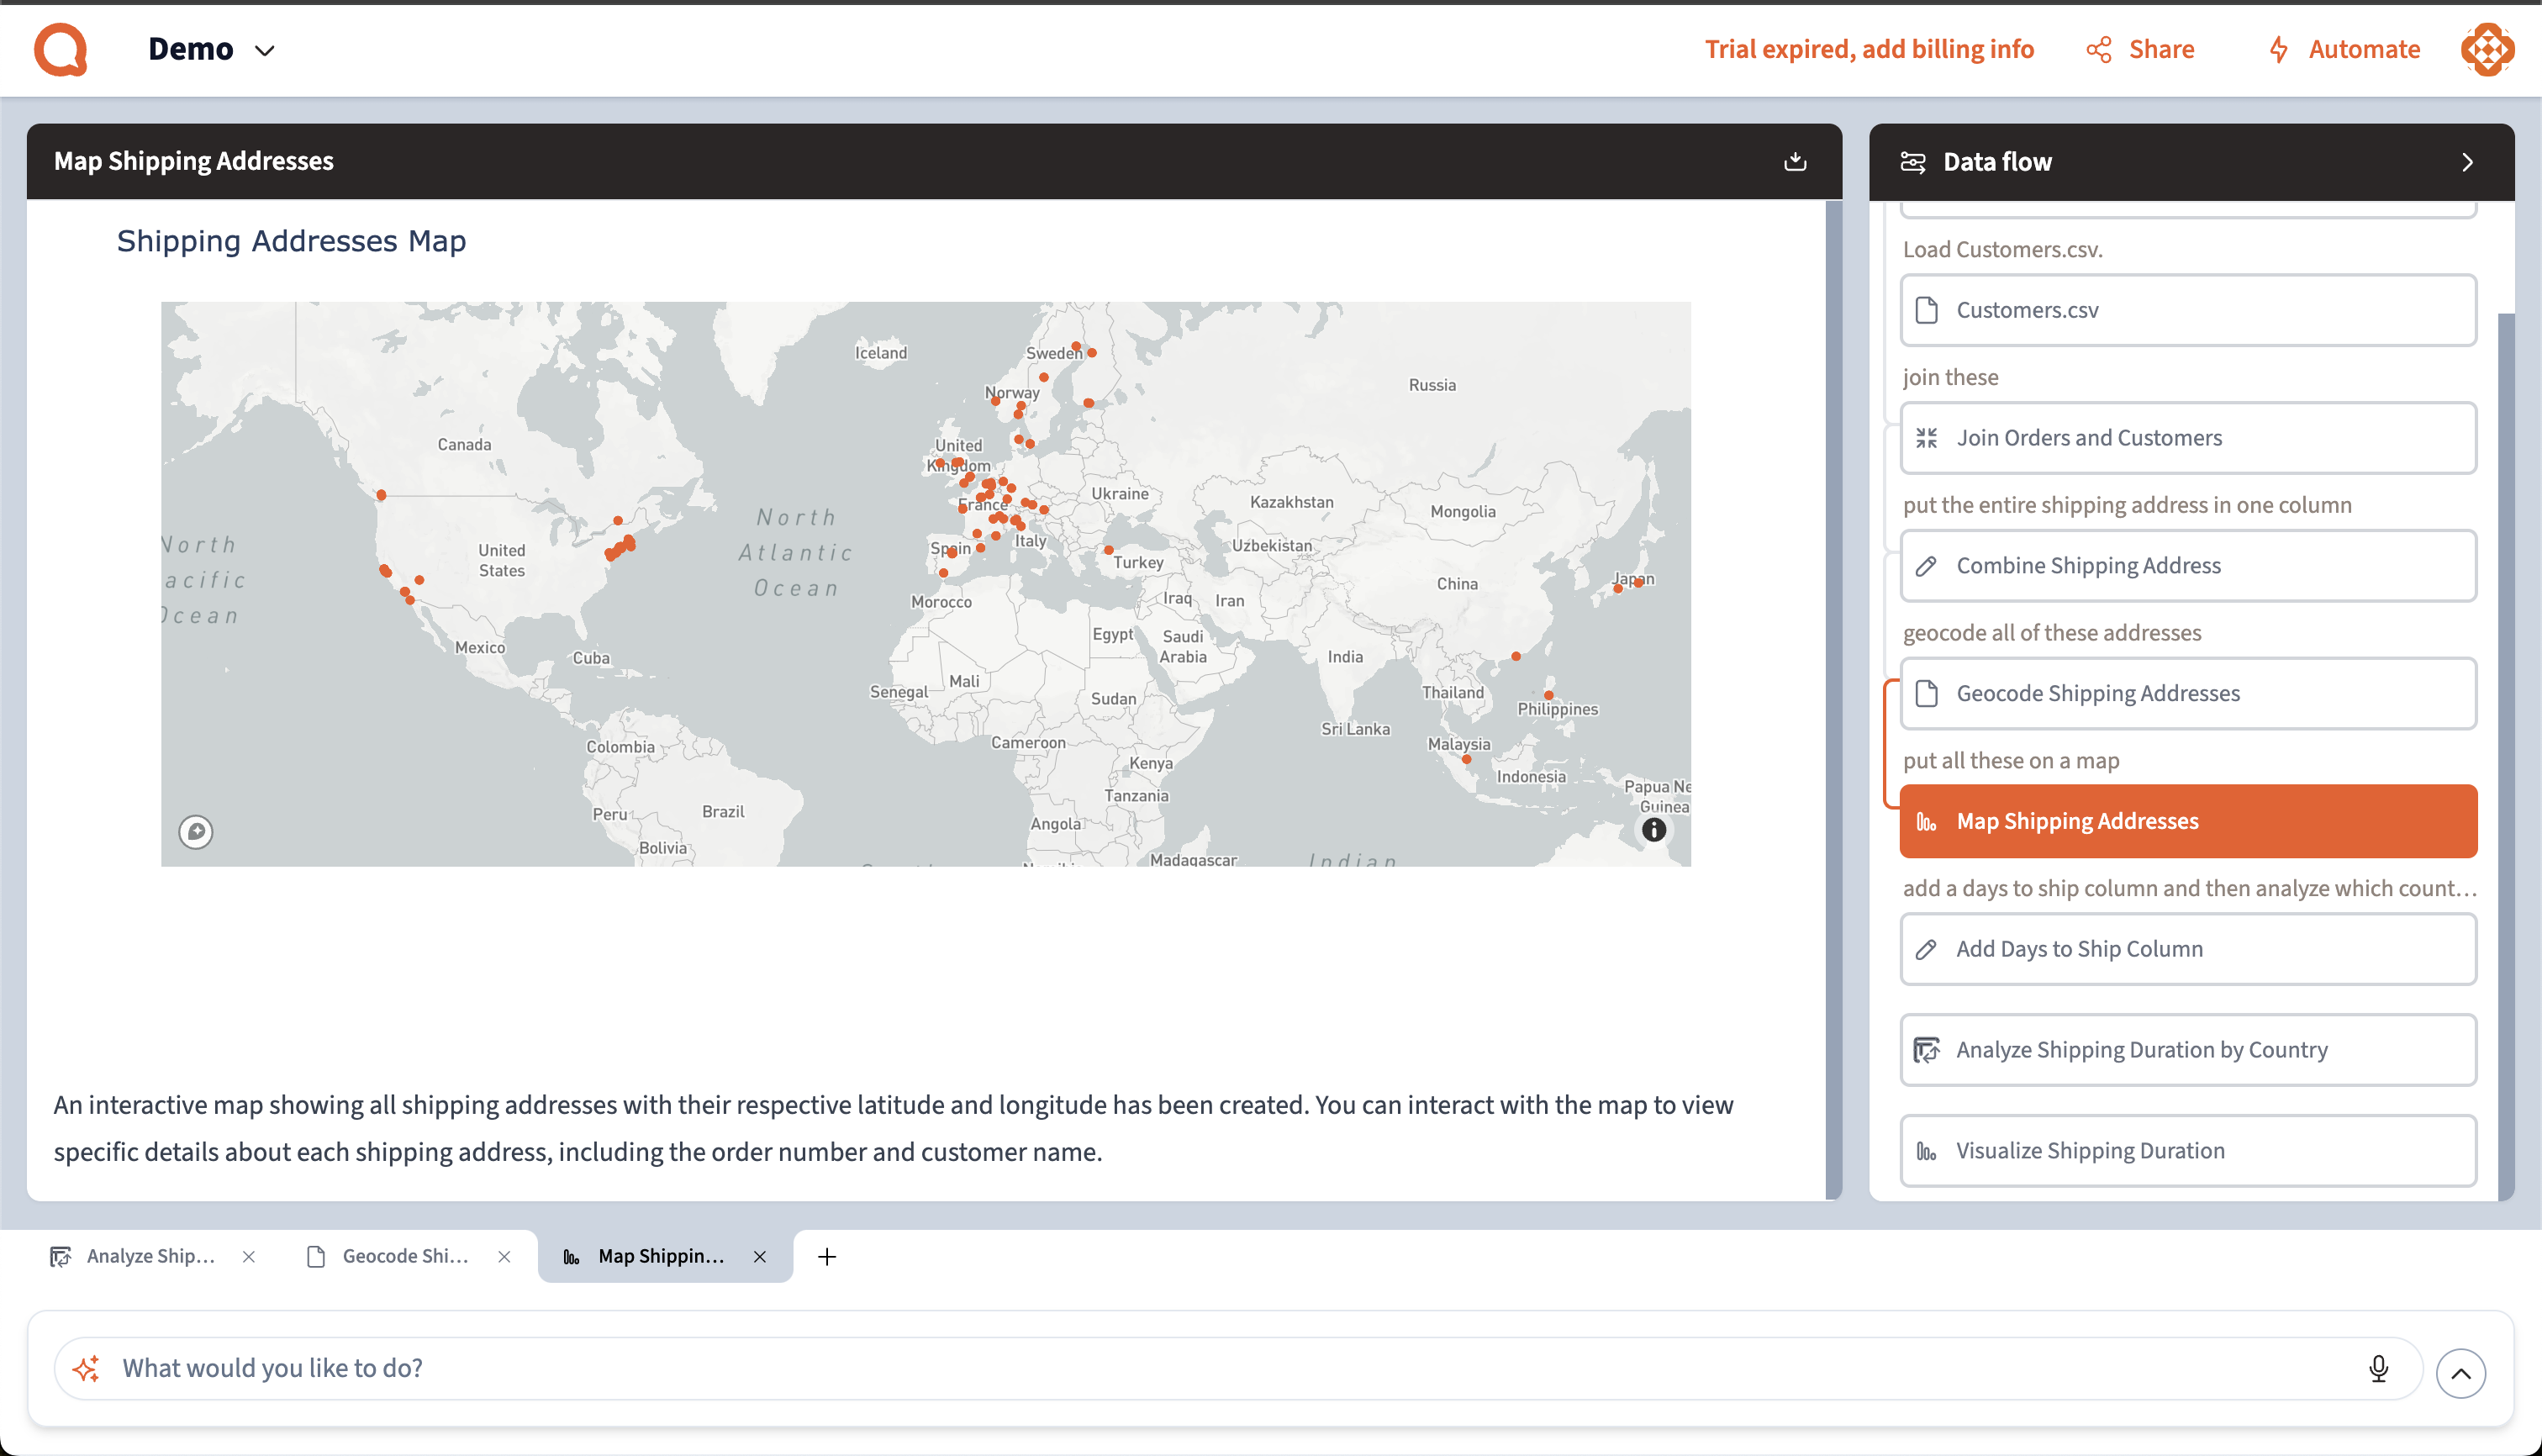
Bring your spreadsheets to life with interactive visualizations
Take messy data, clean it up
Turn addresses into latitude & longitude coordinates, mapping them out with an interactive interface
Analyze your data to optimize shipping lanes, delivery routes and ultimately profit
Streamline your scheduling (read more here)
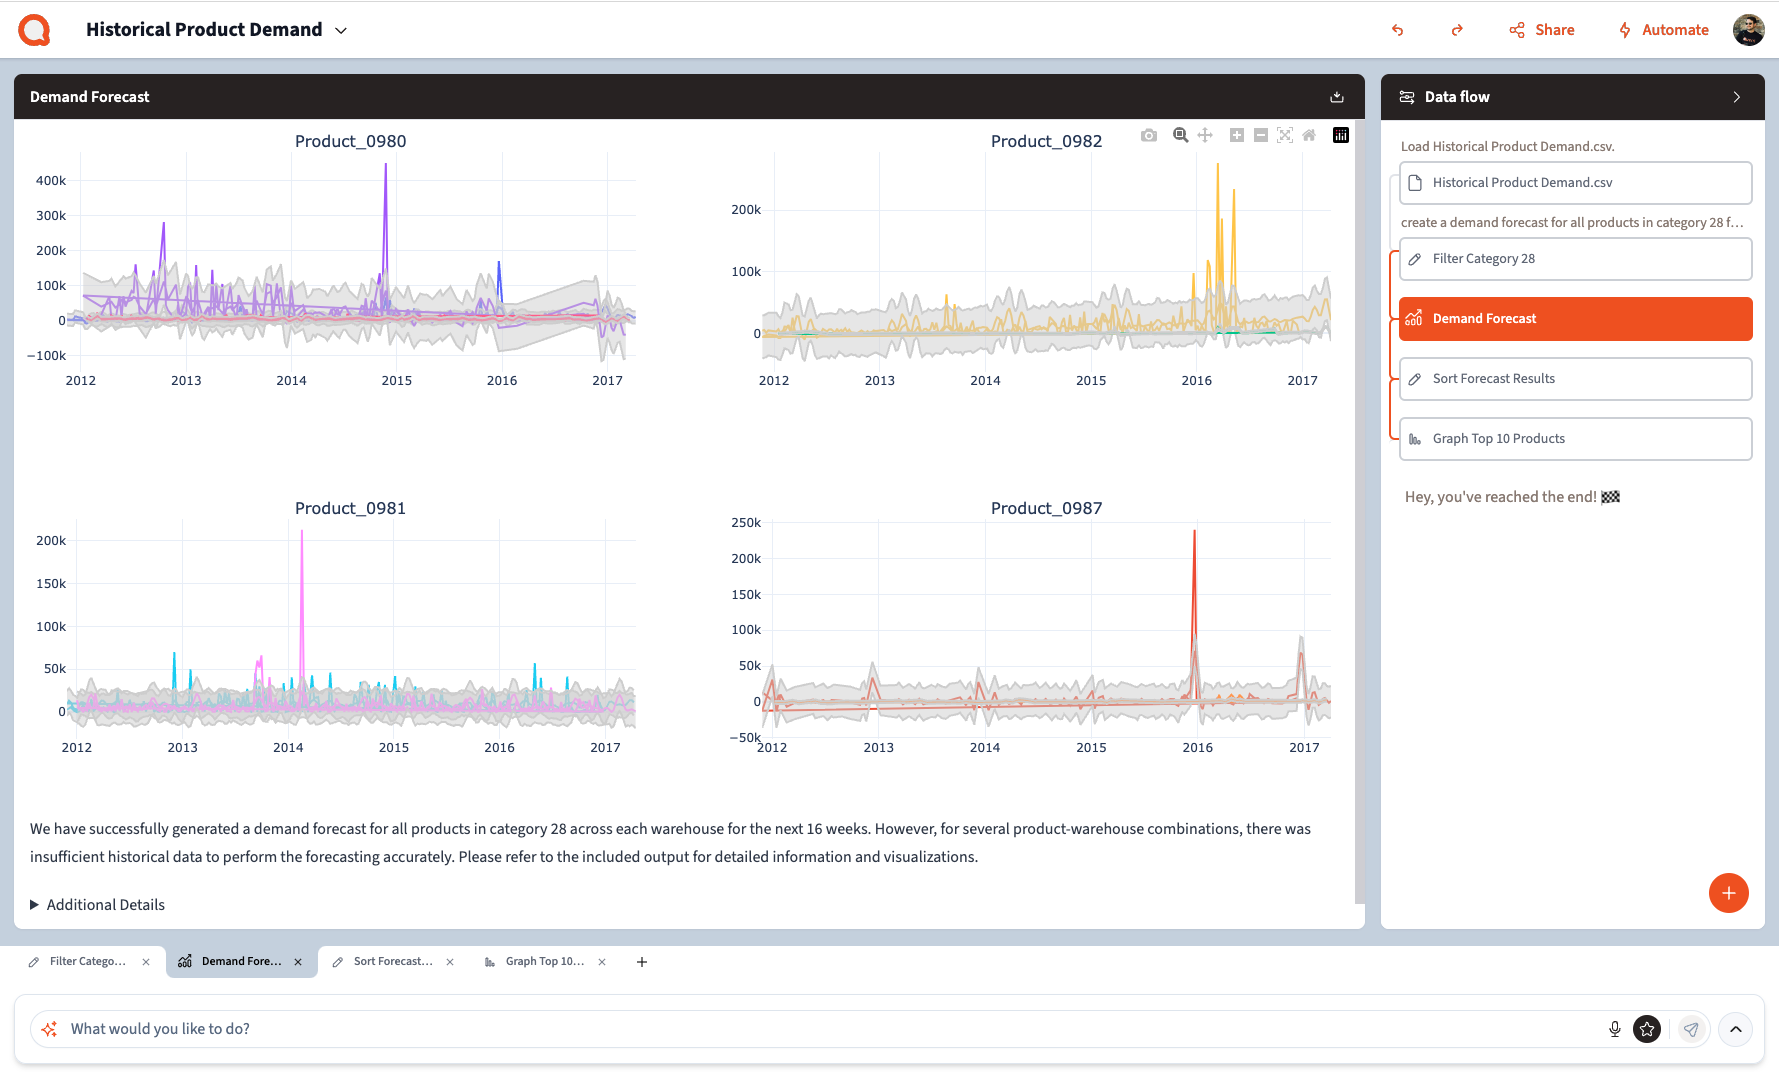
Demand forecasting and inventory management
Querri's Natural Language Processing and data analysis capabilities can ingest raw data from a variety of sources and automatically build out models based on the data given.
This makes it easier to analyze past demands across a wide range of conditions and predict future needs for inventory, seasonal workers, replacement parts and more.
You can read our blog about leveraging data for accurate Demand Forecasting here.
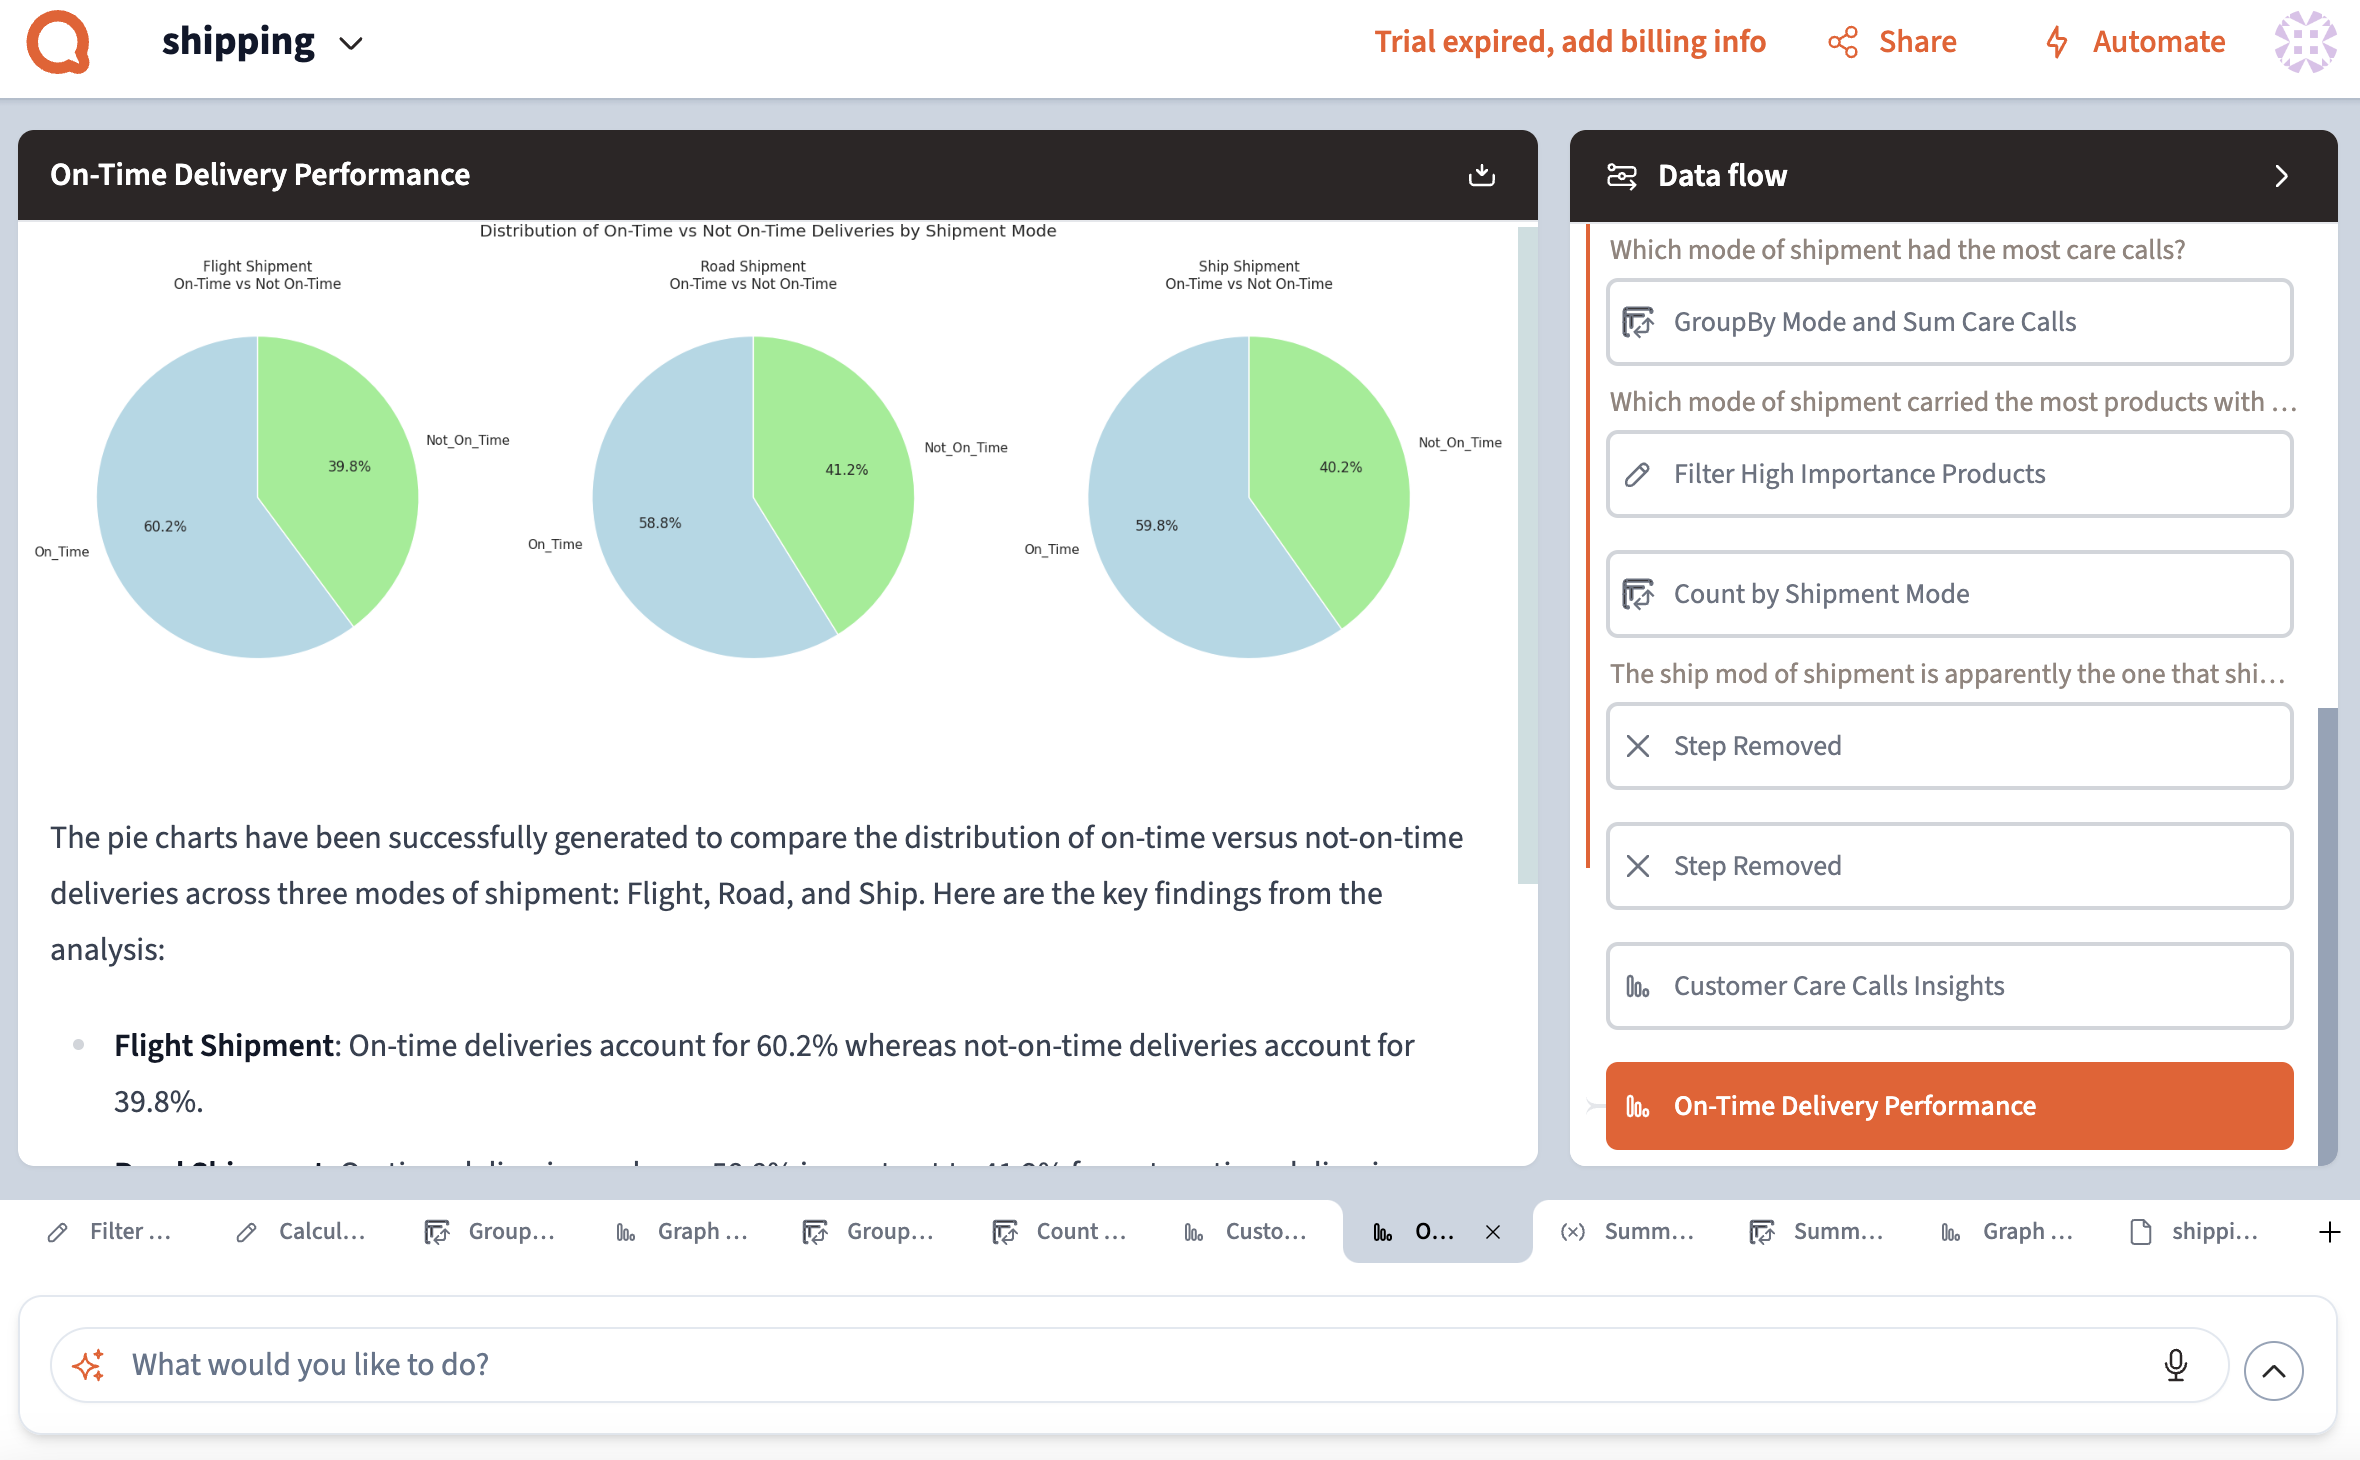
Improve costs & timing across different shipping methods and shippers
Querri can use its data exploration and visualization tools to uncover patterns and help you understand the relationships between time needed and costs across various shipping methods.
By typing your questions in natural language, you can ask Querri anything related to your data and it can visualize the answers.
Why Querri?
Simple ways to do hard
things
Talk to your data through a chat interface and watch it transform in a spreadsheet view.
Reliable, repeatable data
workflows
Clean, merge, and analyze once. Then set up your data workflows to run on your schedule.
Designed for humans, not
machines
It’s not a black box. See an explanation of the data workflows behind every Querri.
Get talking with your data now